Data Workflows
This documentation outlines the workflow of data within a data warehouse generated by beVault, adhering to the Data Vault methodology. The data warehouse is organized into distinct layers, each represented by a specific schema:
Staging Area (stg): The initial landing zone for raw data.
Raw Vault (dv): The core layer for storing raw historical data in a highly normalized format.
Business Vault (bv): An extension of the raw vault, providing derived data structures that offer more business context.
Information Mart (im): The final layer where data is structured for reporting and analytics, optimized for performance.
This documentation provides a step-by-step overview of the data processing stages, detailing the flow of data from its initial ingestion to its final transformation into meaningful information marts. Each step is crucial for ensuring data accuracy, consistency, and availability for end-users.
Legend
Solid Rectangle: Represents a physical table in the database.
Dotted Rectangle: Represents a view in the database.
Solid Arrow: Indicates data movement from one table to another via loading views.
Dotted Arrow: Indicates data movement using a custom script stored in the "Distribute" module.
Step-by-Step Workflow
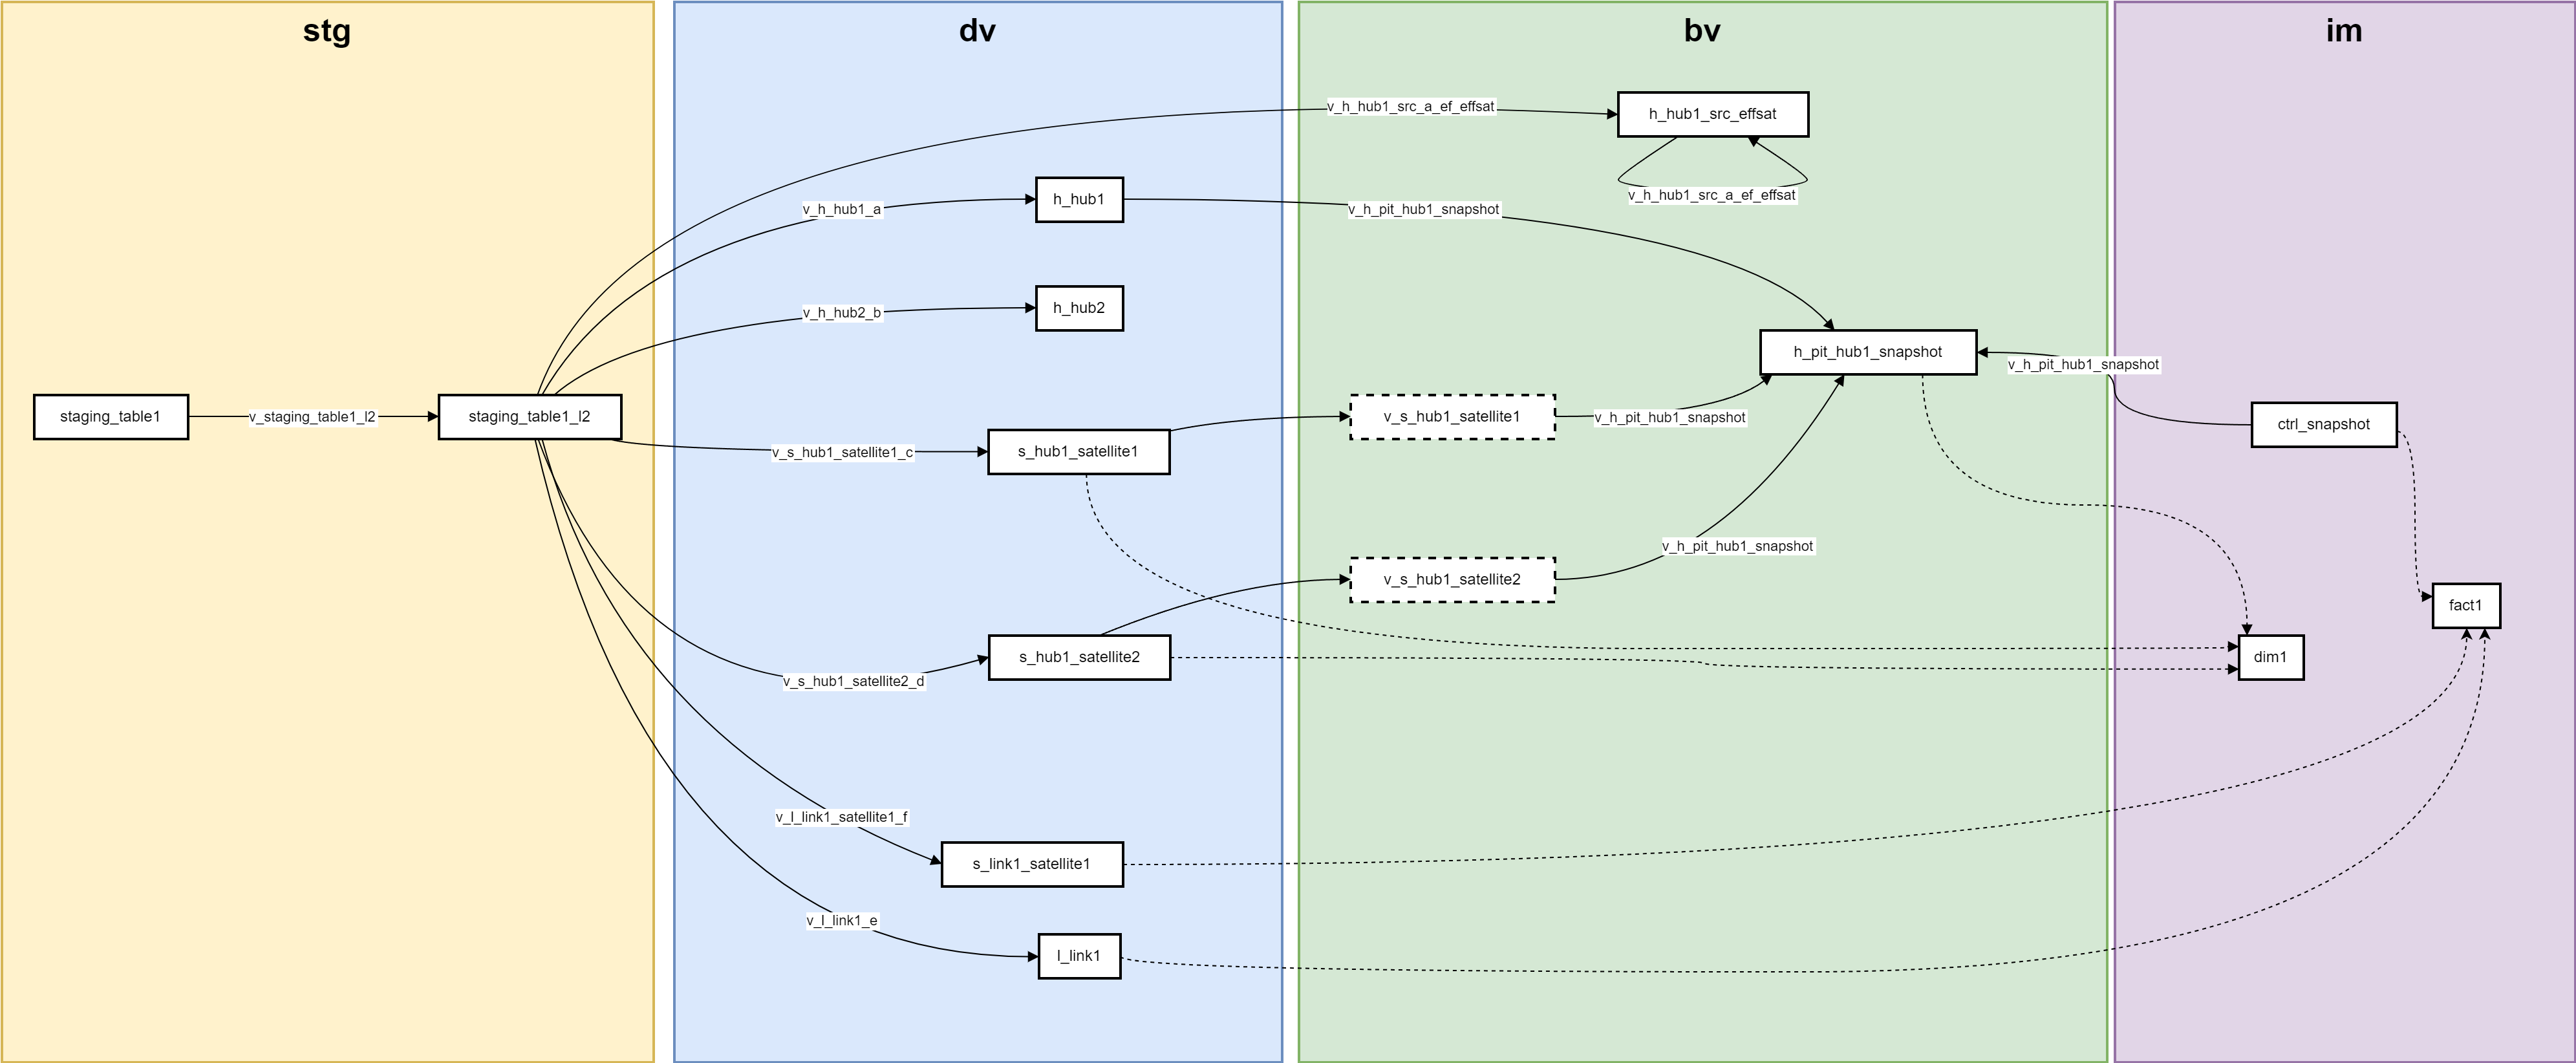
Loading Data into Staging Level 2 (stg)
Data from the staging tables are loaded into the staging level 2 tables.
During this step, hard rules are computed, and hash keys and hashdiffs are generated.
Loading Data into the Raw Vault (dv)
Data is loaded into various entities (hub, link, or satellite) in the raw vault.
There is one view per mapping to load the data from the staging level 2 tables into the corresponding entity in the raw vault.
Updating Effectivity Satellites
Effectivity satellites (effsats) are updated based on the existing data in these tables and the current data present in the staging level 2 tables.
The effectivity satellites are used to track the presence of a business key or relationship inside a source.
Data that is currently present in the satellite but that cannot be found in the staging level 2 are invalided, whereas the data only present in the staging level 2 are inserted in the effectivity satellite.
Computing Pit Tables
Point-in-time (PIT) tables are computed to optimize queries.
Snapshot tables from the information mart layer are used to define the different points in time present in the PIT tables.
Views of the satellites in the business vault layer contains a load end date computed with a window function to know the validity of a record. These views are used by the pit tables to know which record was active at a specific point in time (snapshot date).
Generating Information Marts (im)
Information marts are generated, which may use entities from the business vault, such as PIT tables and bridges, or directly use entities from the raw vault.
Custom scripts stored in the "Distribute" module are used for generating the information mart views and tables, as indicated by dotted lines in the diagram.
Summary
Staging (stg): Initial data loading and transformation with hash computation from the staging lvl1 to the staging lvl2.
Raw Vault (dv): Loading data into hubs, links, and satellites using views for each mapping.
Business Vault (bv): Updating effectivity satellites to track business keys and relationships and generating pit tables.
Information Marts (im): Final data marts using entities from both the raw and business vault layers.
This workflow outlines the systematic process of data movement and transformation within the data warehouse, following the Data Vault methodology to ensure data integrity and efficient access.
Data Quality workflow
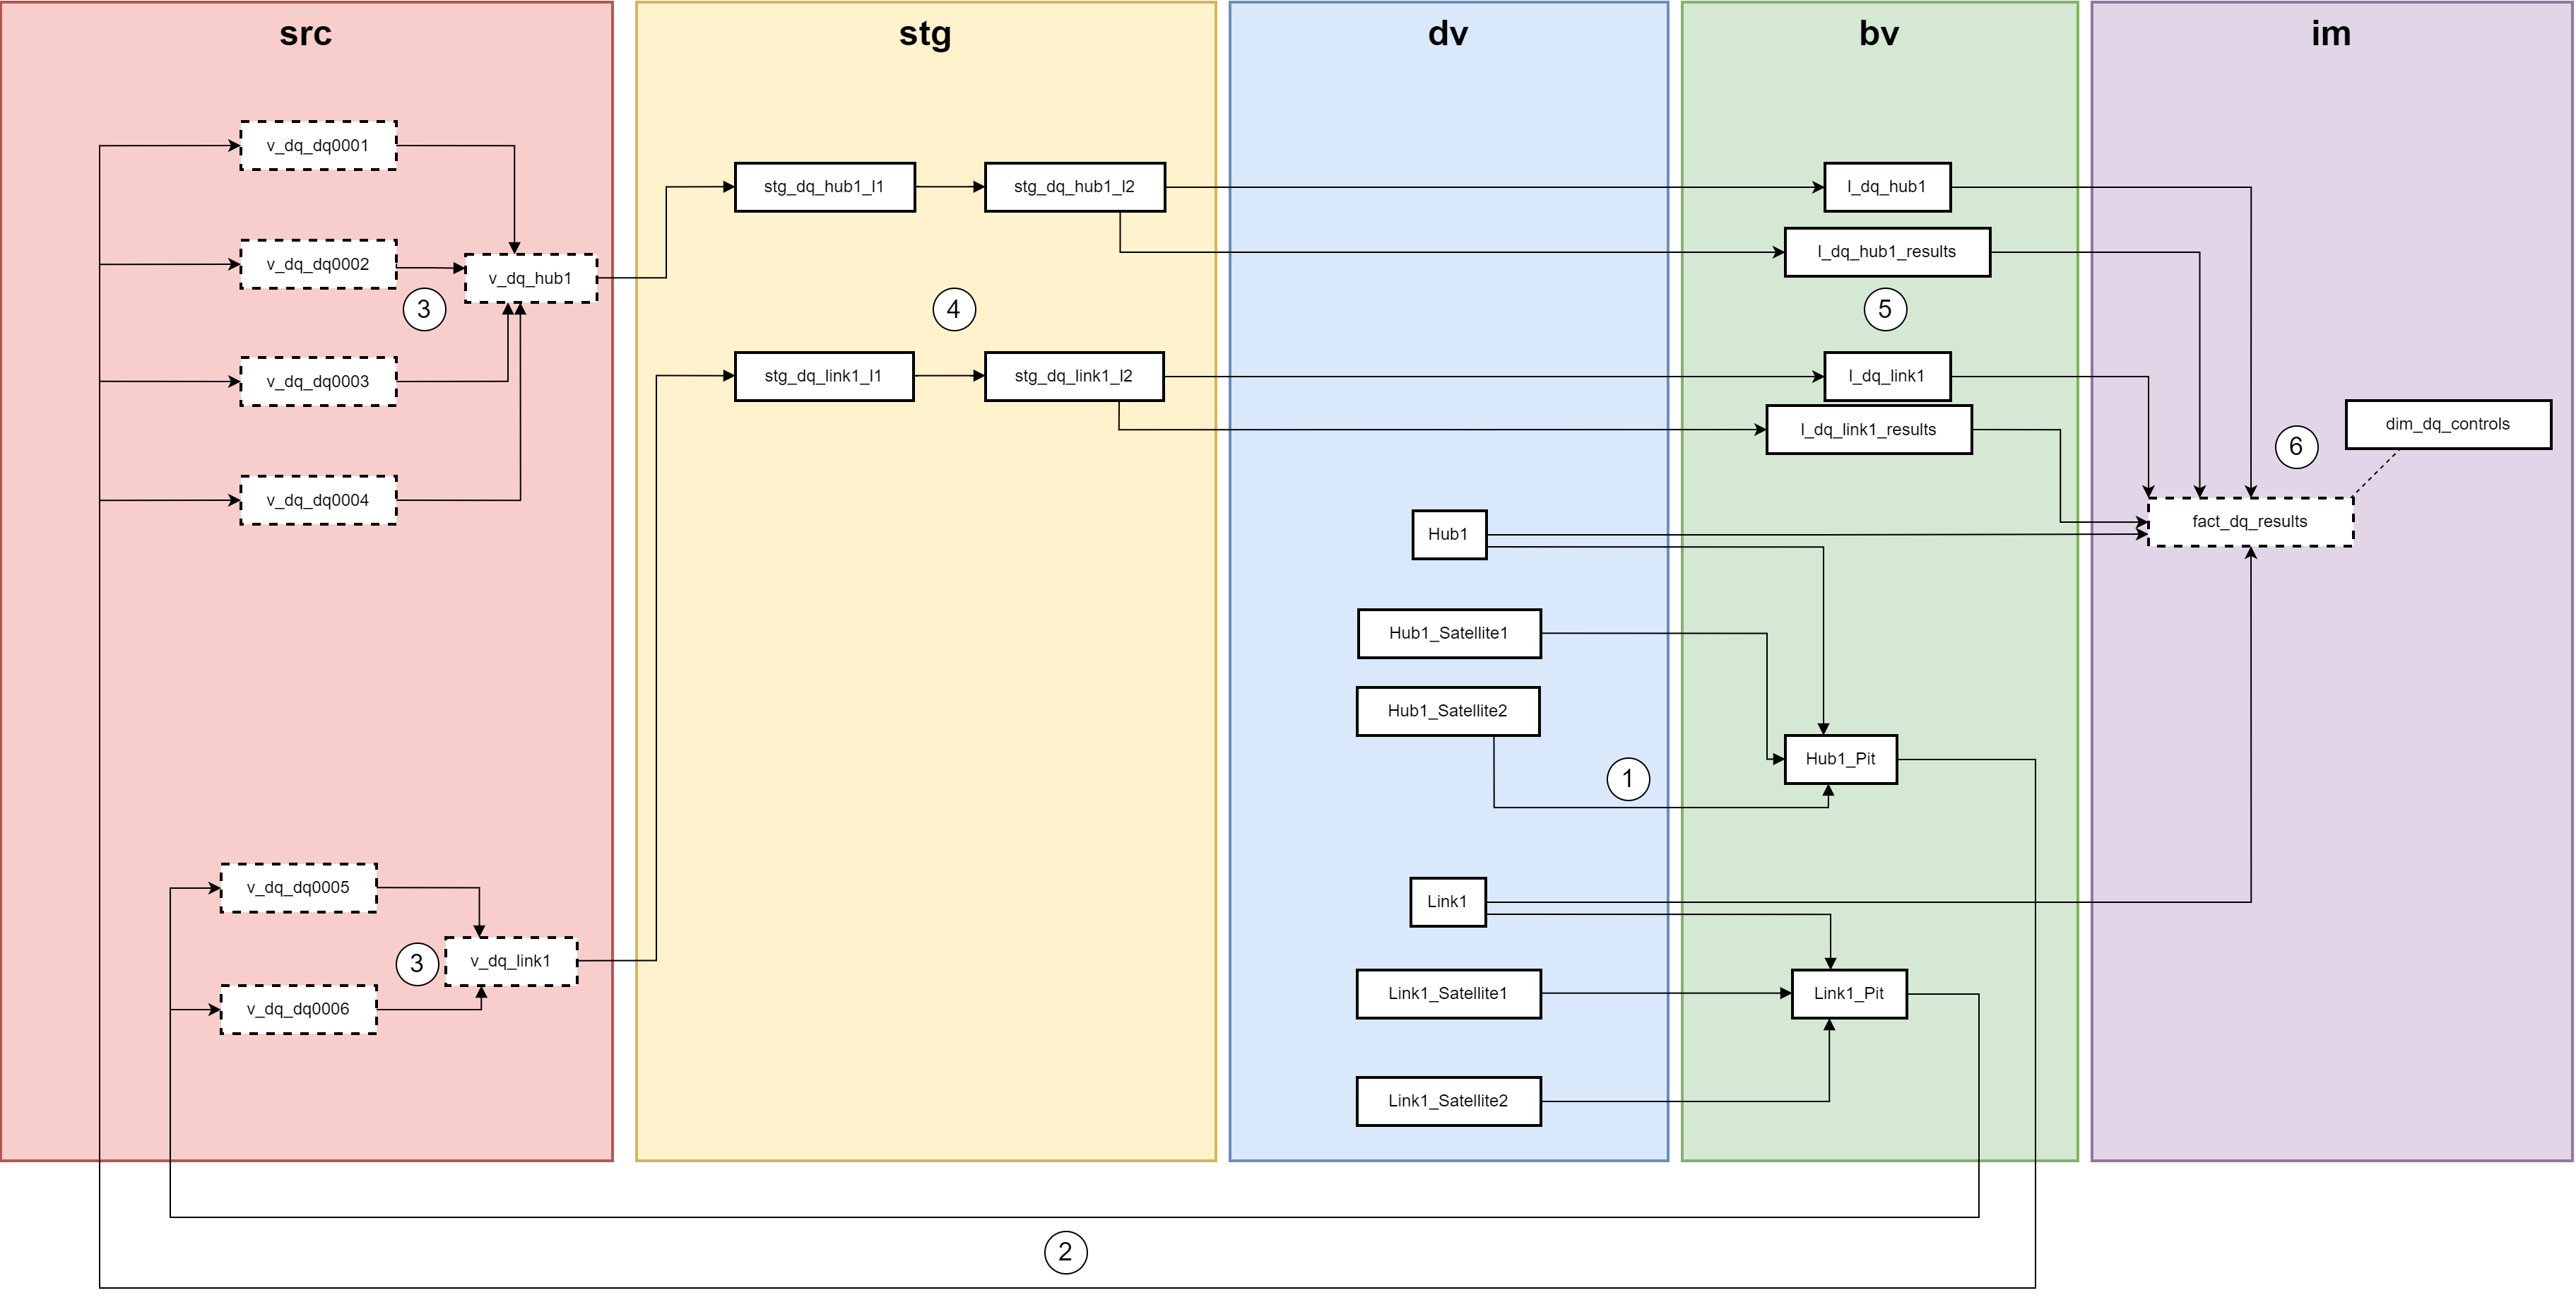
A PIT is created based on the entities found in the raw vault (dv). This is done to improve the performances of the data quality controls and to use data at a specific snapshot date for our controls.
Based on the PIT, one view is created for each data quality control in the Source area to compute the data quality test.
A view is created for each entity (Hub or link) on which quality tests are performed that will aggregate all results from each data quality.
The view is then used as a staging table. The hash keys and hash diff are computed in the staging level 2 table (cfr workflow above)
Data Quality results are persisted into the Business Vault as a Link and a Satellite.
The results and the list of controls are aggregated in a star schema with a fact and a dimension. This star schema can be used in the orchestrator to send the data in a dashboard or any other tool.